OpenDBM Visual Analytics Interface
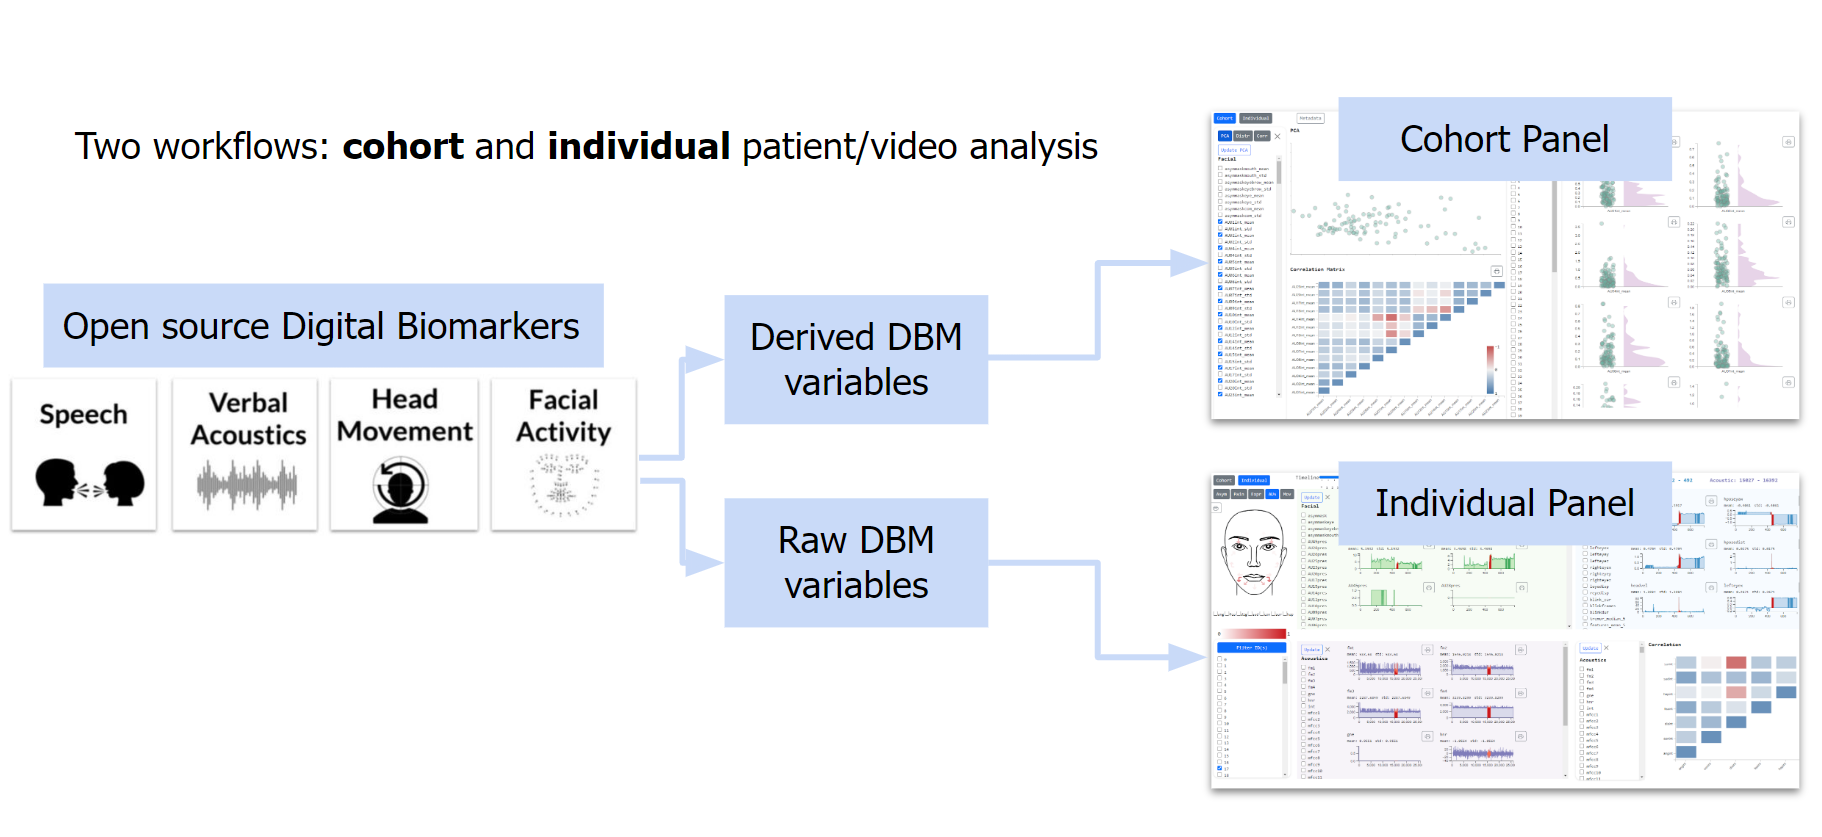
Cohort Panel
Individual Panel
Setting up and Running the Visual Analytics Interface
Note for Linux Distributions (e.g. Ubuntu or WLS on Windows):
It can help to run the following from time to time
sudo apt upgrade && sudo apt update
Prerequisites
- Install OpenDBM following the documentation link or pull the latest changes in the Github repository
- Install nvm (latest version; remember to restart shell)
- Install node with nvm (nmv install npm, latest version of npm
- Nvm use node
$ Node -v
> v18.7.0
or
$ Npm -v
> 8.15.0
- Make sure your OpenDBM output folder is in the main directory - open_dbm folder, ( if you have a folder called output_data, it needs to contain the OpenDBM output data format, in other words, it needs to contain the derived_variables and (optional) raw_variables folders)
Running the visualization_interface
If everything is stood up correctly, and your python interpreter can pull from the respective virtual environment do the following:
Windows:
./run_dashboard.sh <output_data_folder>
Linux:
$ sudo chmod 777 run_dashboard.sh
$ ./run_dashboard.sh <output_data_folder>
Mac:
- If you want to run the app with the OpenDBM output folder from the repository’s sample_data, you can run
$ ./run_dashboard.sh sample_output
Extra Attributes (metadata grouping of cohort)
If you want to run the app with a metadata file for the videos (e.g. if you wish to add an extra attribute such as gender, age range, health condition, treatment etc) you can add a csv file with two columns: id for the video ids and attr for the extra attribute. There can be at most 10 different values for the attr value.
This file has to be placed inside the output data folder, along with the derived_variables and raw_variables folders. To run the VIZ interface with the metadata file use:
$ ./run_dashboard.sh <output_data_folder> <metadata_filename>.csv.
You can test this with the sample metadata file from the repository by running:
$ ./run_dashboard.sh sample_output metadata.csv
Manual Startup
If you cannot run the bash scripts, it's likely because your dependencies were not made available through the setup virtual environment. To work around this you can install the dependencies manually
Prerequisites
- Have an updated npm( V8+) and Node version (V16+) installed on your computer
- Move your data folder (e.g. sample_output) in the open_dbm/visualization_interface /flask-server folder.
- Install dependencies: pandas, scikit-learn, and update your numpy Note for Linux distrubtions:
- all are pip installable
- Need to use python3 vs python when running the backend
Install Dependencies
When running the VIZ tool you need do the following only once.
Linux (includes Ubuntu, WSL, MACOS)
- Sudo apt update and sudo apt upgrade
- Sudo apt install npm (this will give you npm v-6, node v10; these versions are not sufficient to run VIZ interface - and you will need to update them)
- Update versions of npm to v8+ and node v16+ Recommended: install nvm Set up Node.js on WSL 2 | Microsoft Docs Follow instructions. Remember once installed you will need to close and open a new terminal
- PIP install flask; flask –version (flask 2.2.2, python 3.91)
- PIP install pandas (v1.4) numpy (v1.23)
- PIP install scikit-learn
- Move to ~/open_dbm/visualization_interface
- $ npm install
Once the dependencies are completed, you only need to perform the following 2 steps to start up the visualization_interface .
Step 1: Front end
- run npm start to get the frontend starting - this will open a new browser window with the visualization_interface. You will proxy error, which is to be expected because you have yet tell it from where to get the data from (backend part)
Step 2: Backend
-Move your data output folder into open_dbm/dashboad/flask-server folder -if your data folder is in the right location, enter the open_dbm/dashboad/flask-server folder and run source venv/Scripts/activate to activate a virtual environment that will make all the backend dependencies available without any installation. If your terminal prompter contains (venv)(base) you’re good to go and run the backend
- Run the following command python server.py <data_folder>. Refresh the visualization_interface in the browser and you should see it populated with all the data.
Additional
Extra Attributes (metadata)
- To run the visualization_interface with metadata, run the following: python server.py <data_folder> <metadata.csv>. Killing Operations Linux:
$ kill $(lsof -t -i:5000)
Additional React Information
To run the app in the development mode. Open http://localhost:3000 to view it in your browser.
The page will reload when you make changes.
You may also see any lint errors in the console.